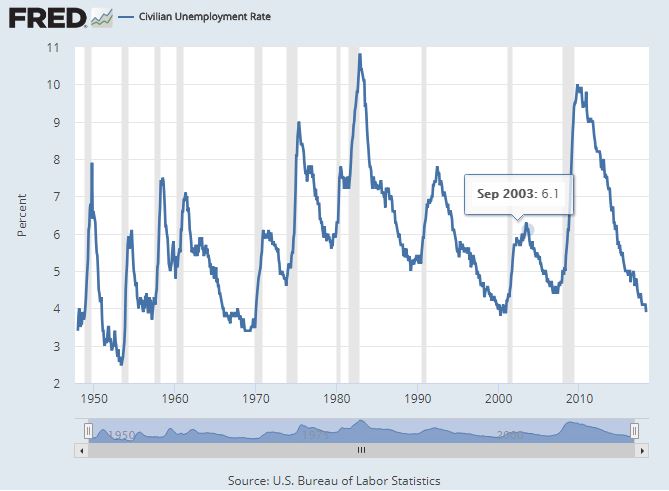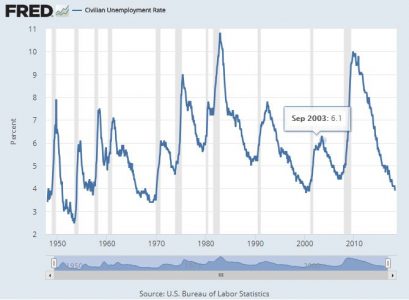
United States Civilian Unemployment Rate from January 1948 to April 2018
“It’s tough to make predictions, especially about the future.” ~Yogi Berra
In the accompanying chart of the United States civilian unemployment rate from January 1948 to April 2018, one can clearly see that the economic recovery we are currently in, if defined by a drop in unemployment, is one of the longest and most pronounced in modern history. This is an element of the Goldilocks environment for commercial property investors, a solid economy driving rents up and vacancy down while interest rates – although in the upper end of their range for the prior decade – remain relatively low.
“If something cannot go on forever, it will stop.” ~Herbert Stein
The intuitive sense in looking at this chart is that is should have been obvious at each bottom that unemployment would soon uptick. In reality, it isn’t so obvious in the moment. Like with many things, you don’t know it is over until it is. As is wryly said, it ain’t over until its over.
What is indeed noticeable in this period is that the unemployment rate is near its lowest bottom but for the one in the fifties, and in all fairness the post WWII era of bobby socks and carhops seems less relevant. The drop from unemployment’s high point of 9.9% in late 2009 down to 3.9% in April 2018 is a standout 6 percentage points. Of the recoveries represented in this chart, only one comes close, the 1983-89 recovery during which the country enjoyed a 5.8 percentage point decrease. Also note that each time the unemployment rate has bottomed, in run up (in the unemployment rate) is fast, furious, and surely met with societal angst. Those with a more academic bent are sure to scoff at what is essentially a sure-looks-it notion, preferring to pay attention to things more ivory tower worthy like a flattening yield curve as potential predictors. The retort? It sure looks it.
“The future ain’t what it used to be.” ~Yogi Berra
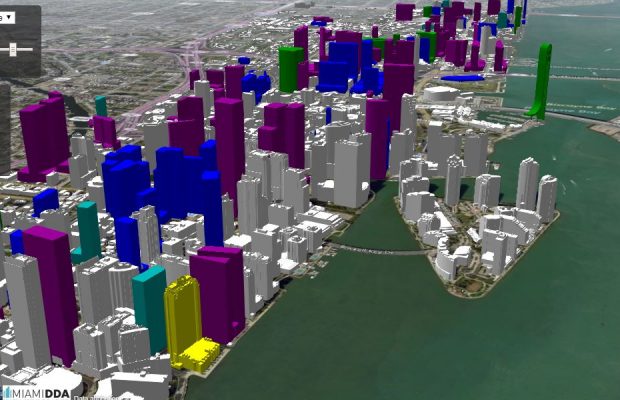
So what does this mean to commercial real estate investors? First, they have been in a great environment for ownership. Whether that will continue is anybody’s guess. On the plus side, this recovery is already beyond the norm, thus it isn’t unreasonable to think that it could go on for a while longer. I certainly have no idea. Some would say this long run is only a sign that it is about over. Eventually, they’ll be right. A slowdown is not good for vacancy rates or rent growth, and thus negative for property values, but at least should lead to a less tight credit market, likely good for property prices, perhaps acting to cushion some of any negative effect. Further, Miami area investors also have the luxury of ownership within one of the more exciting and fast growing locales, now with the third most dense skyline in the United States and within a state that nearly a thousand people move to each day.
Related: